Selected Projects

Analyzed the impact of socioeconomic status on 'Improve Detroit' requests across neighborhoods. Key findings include the strong correlation between new vacant properties and request volume, and the negative correlation of higher median earnings and home values with requests. Developed a predictive model with an Adjusted R^2 of 0.613 using median earnings and new vacant properties.
Keywords
Data Visualization, Natural Language Processing, Regression Analysis, Supervisied Machine Learning, Data Modeling, Data Warehousing, Data Transformation, Data Cleaning
Tech Stack
- Python
- Tableau, Seaborn, matplotlib
- Scikit-learn, statsmodels, Scipy
- Pandas, Numpy
- NLTK, GPT

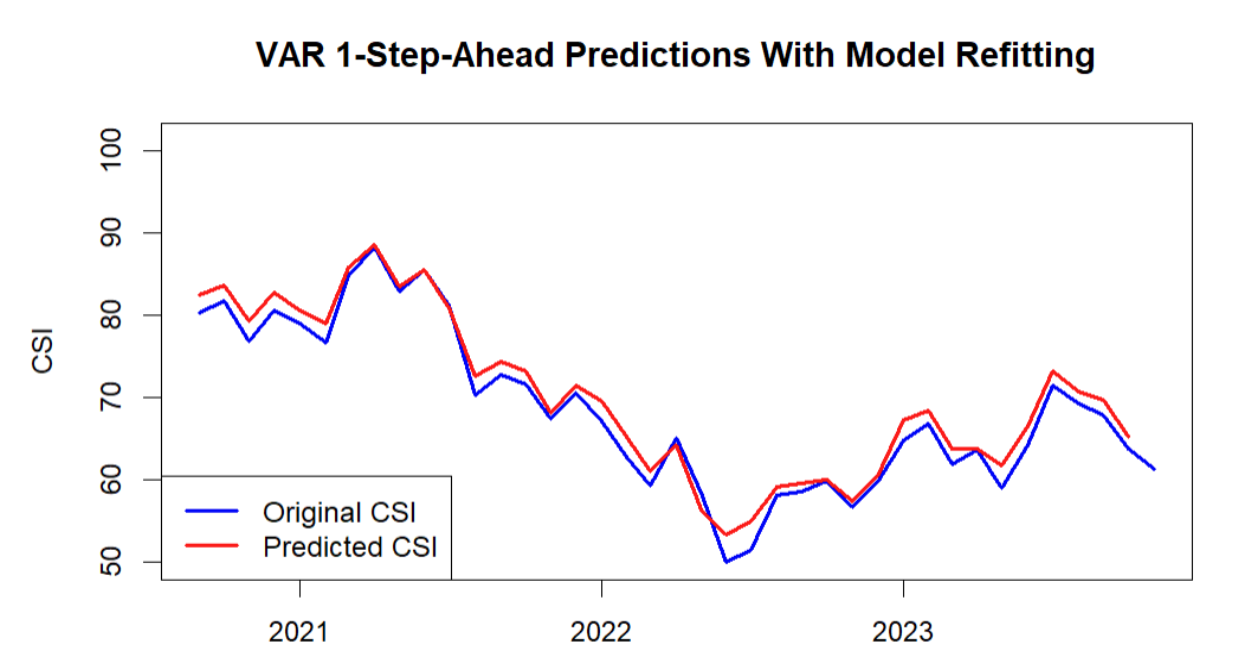
Utilized Google search trends and economic indicators to forecast CSI using machine learning models. Key findings include the VAR model achieving an R² of 0.973 and RSE of 2.08 with significant predictors: previous CSI values, employment, mortgage rates, and total vehicle sales. Addressed ethical considerations such as sampling bias and prediction consequences.
Keywords
Time Series Analysis, Supervised Machine Learning, Regularization, Data Visualization
Tech Stack
- R, Python, SQL, C++, Excel
- Pandas
- ggPlot
- Google Trends API

Segmented customers using clustering techniques on a toy car sales dataset from Kaggle. Key steps included extensive data cleaning, normalizing geographical variables, and applying K-means clustering. Identified five distinct customer segments and visualized clusters using PCA. Clusters were described based on metrics like order quantity, price per unit, demand, and purchase timing.
Keywords
Data Visualization, Clustering, Data Cleaning, Data Normalization
Tech Stack
- Python
- Pandas, matplotlib, Seaborn
- Scikit-learn: K-means Clustering, PCA, StandardScaler

MOOC Dropout Prediction
This is a sponsored project with Rapid Canvas.
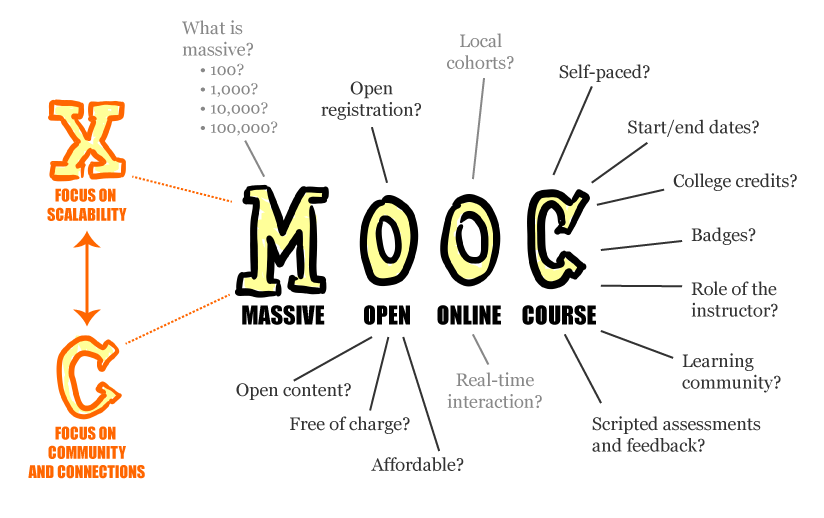
Analyzed MOOC data to predict student dropout rates using user watch time, course completion status, rewatch percentage, and sittings per video. Key steps included EDA, and applying machine learning algorithms like XGBoost, Random Forest, AdaBoost, Gradient Boost, and K-means. Utilized tools like Tableau, Google Big Query, and Sklearn for data processing and model building, identifying patterns to improve student retention.
Keywords
Supervised Machine Learning, Cloud Computing, Data Warehousing, Data Modeling, Data Cleaning, Data Visualization
Tech Stack
- Python, SQL: Google Big Query
- Tableau
- Pandas, NumPy
- Scikit-learn: XGBoost, Random Forest, AdaBoost, Gradient Boost